What Happens After Big US Election Week Stock Declines?

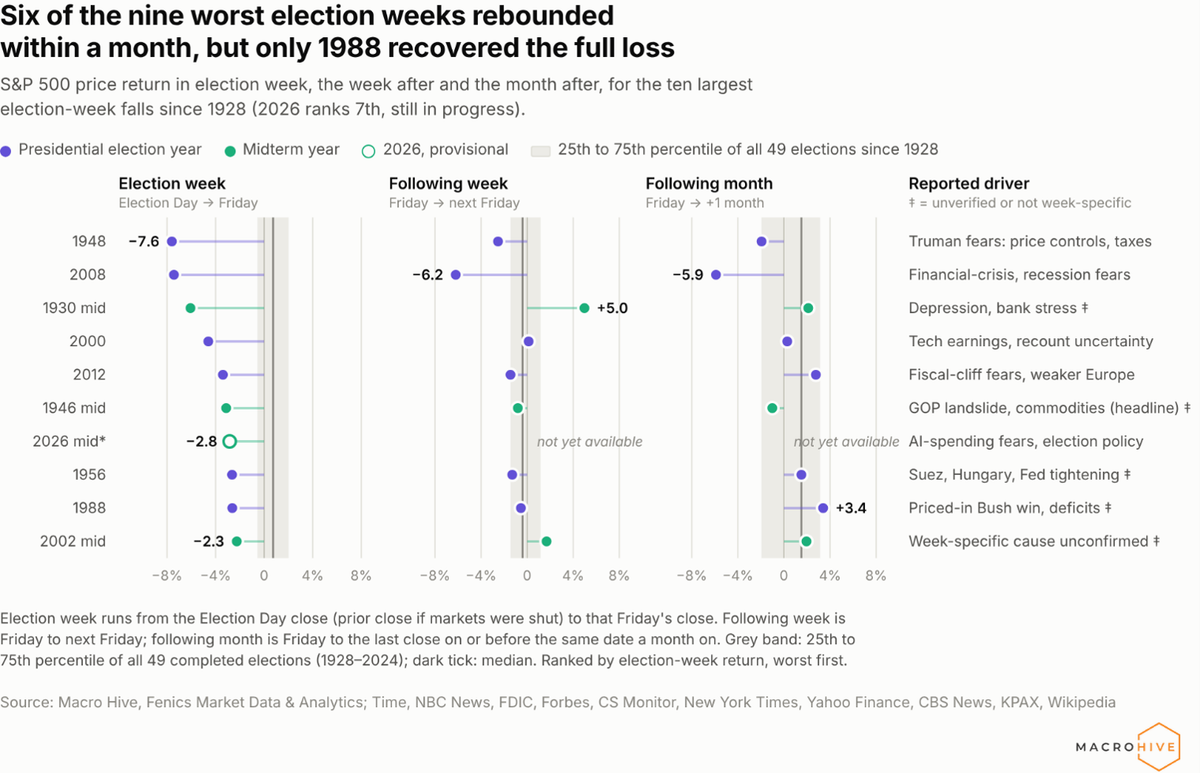
US stocks have fallen close to 3% since the midterm results. This puts it at the 7th worst election week decline in US history (Chart 1). The question is what next. I look at the week- and month-after returns to see any patterns.
- 1948 Truman surprise win. The largest drop was Democrat Truman’s surprise win in 1948. There was a massive consensus that Republicans would win that polling stopped in the run-up to the election. The market plunged 7.6% on election week on fears of price controls and higher taxes. The following week, stocks fell another 2.5% before stabilising.
- 2008 GFC election. The second largest drop was 7.4% when the election coincided with the Global Financial Crisis. Stocks fell another 6% the following before stabilising.
- 1930 depression midterm election. The Democrats (eventually) gained the House and almost the Senate, during the Republican Hoover presidency. Markets initially dropped as perceived gridlock combined with a concurrent banking crisis stoked fears. But markets rallied the following week as Democrats showed unity with President on how to deal with the bank run.
- The rest. As for the remaining top ten drops there was no clear pattern on persistence in declines, but generally the moves were small.
Lessons for today, some of the more dramatic election declines occurred during crises or major interventionist policy periods (price controls), which offer little guidance for today. Instead, we find that most election week drops, especially after midterms, rarely see persistent large declines. This offers a note of optimism.